Spending time on social media, blogging and general web promotion can be time consuming. When your boss asks how those efforts are increasing web traffic, be ready with some solid stats that will speak for themselves.
Alexa Ranking
Alexa.com is a site that ranks websites based on its average visitor traffic for the past three months buy visitors with the Alexa toolbar installed on their browser. Your site is pitted against every other website on the Internet that is competing for traffic and your Alexa ranking number is where you stand among the masses. You are not able to go back in time to see past results so check this number regularly to track your site’s ranking progress.
Google Analytics
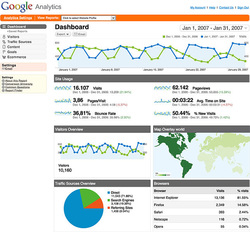
You did install the free Google Analytics code in your website right? If not, you should as it provides a clear view of the traffic coming to your site. Google Analytics delivers all kinds of data about the traffic coming to your site. Some of the best stats to track include:
· Number of Visitors- The very basic number of how many visitors are coming to your site.
· Unique Visitors- This is how many new visitors you are attracting vs. those who come back time and time again.
· Source of Traffic- This breaks down how people are finding your site; be it through organic search, referral, direct traffic or other.
· Social Referral- If you are utilizing a social media strategy, this data can tell you how well those efforts are pushing traffic over to your website.
· Length of stay- This number will reflect the quality of your content and your site’s overall ease of use for a visitor. If the average visitor is spending only 30 seconds on your site then the content, and possibly the site layout, is not compelling enough to keep visitors engaged.
Be proactive and start tracking these stats before your boss even asks. Keep a regular tracking schedule to gather the information, it can be monthly or quarterly. The great thing about Google Analytics is that you can look back at any moment in time to obtain the information, however do you want to spend a chunk of time gathering a years worth of data or spend a few minutes each month. If you organize the numbers in an Excel spreadsheet you can then create various charts and graphs that can be incorporated into a visual report showing the growth brought on by your efforts.
Image Source: WikiMedia Commons

 RSS Feed
